Anatomy of an Eval Harness
Last week I got the LM Evaluation Harness running end-to-end. This week I wanted to understand how it actually works. What happens between feeding in a prompt and getting back a score? Where does the time go when evaluating something like Pythia 6.9B on a few metrics?
Disclaimer: This is just an intro and we will not touch on ways to make the evals scalable just yet.
What Is the Eval Harness?
The LM Evaluation Harness is a standard tool for benchmarking language models. You point it at a model, pick some tasks (MMLU, HellaSwag, LAMBADA, etc.), and it spits out scores. Simple interface, complex internals.
At its core, nearly every task boils down to one thing: log-likelihood computation. The model sees a prompt and a continuation, and we ask: how probable did the model think that continuation was?
\[\text{LogLik}(x, y) = \sum_{t=1}^{|y|} \log P(y_t \mid x, y_{<t})\]For prompt x and continuation y, sum the log-probabilities of each token in y.
This single number drives everything. Multiple-choice tasks compare log-likelihoods of different answer choices. Perplexity is just exponentiated average log-likelihood. Even “generative” metrics often rely on token probabilities under the hood.
Rolling Log-Likelihood: Handling Long Contexts
Models have a maximum context length, usually 2048, 4096, or 8192 tokens. But evaluation datasets can be much longer. So the Harness uses rolling windows:
- Take a chunk of tokens that fits in
max_length - Run a forward pass to get logits
- Slide the window forward by some stride (often 512 or 1024 tokens)
- Repeat until you’ve covered the full sequence
- Aggregate the log-probs across all windows
This is how you can evaluate on datasets like LAMBADA (which has long contexts) or PG19 (entire book chapters) without running out of GPU memory.
Anatomy of a Single Evaluation Call
Here’s what happens every time the Harness scores a single example. This loop runs thousands of times per benchmark:
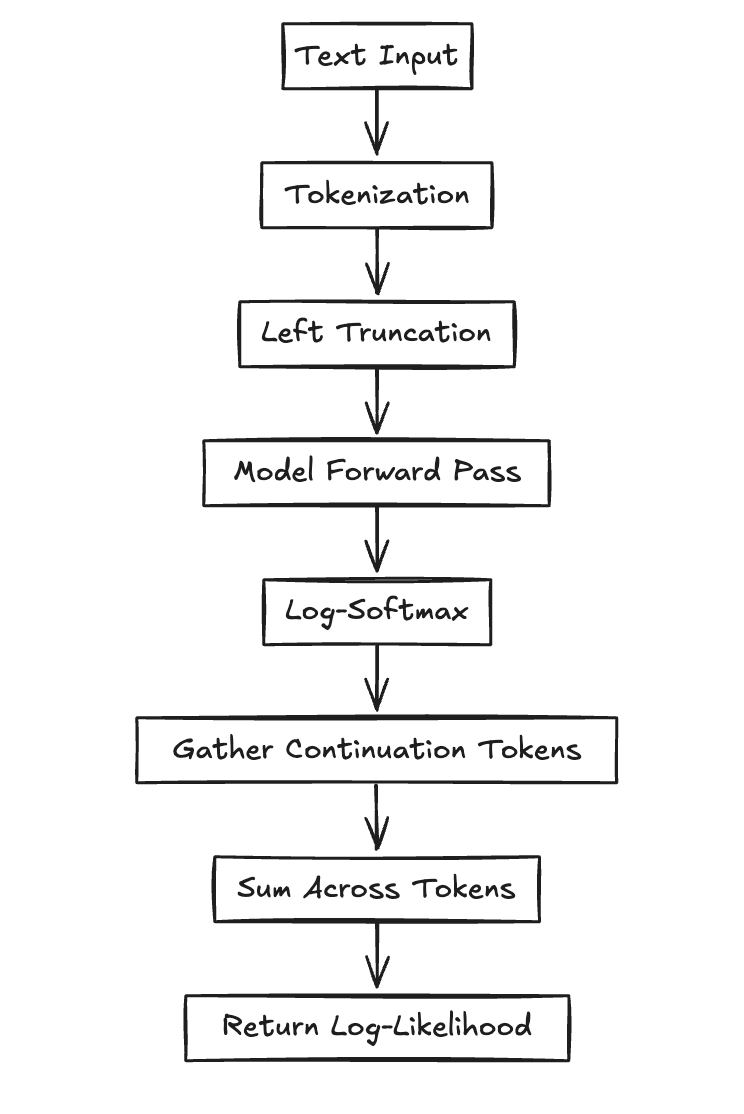
The Pipeline Steps
1. Tokenization
Raw text goes to token IDs plus attention mask. We typically use left truncation to keep the final tokens (the prediction target).
2. Inference Context Setup
torch.no_grad() disables autograd. torch.autocast() enables mixed-precision (FP16) for faster inference.
3. Forward Pass
The model takes input_ids and returns logits: a tensor of shape [batch, seq_len, vocab_size].
4. Log-Softmax
Convert logits to log-probabilities: torch.log_softmax(logits, dim=-1)
5. Token Selection
torch.gather() pulls out the log-probs for the actual continuation tokens (not the whole vocab).
6. Aggregation
Sum the log-probs across tokens to get the final log-likelihood.
The Code
Here’s what that looks like in code:
with torch.no_grad(), torch.autocast(device_type="cuda", dtype=torch.float16):
    logits = model(input_ids).logits  # [batch, seq_len, vocab]
    log_probs = torch.log_softmax(logits, dim=-1)

    # Extract log-probs for the actual continuation tokens
    target_log_probs = torch.gather(
        log_probs[:, :-1, :],
        dim=2,
        index=input_ids[:, 1:].unsqueeze(-1)
    ).squeeze(-1)

    # Sum across tokens
    log_likelihood = target_log_probs.sum(dim=-1)
This block runs thousands of times in a typical evaluation run. So where does the time actually go?
Profiling: Where Does the Time Go?
I wanted to understand the time breakdown when evaluating Pythia 6.9B on a few metrics. So I set up a simple profiling script.
The results:
| Phase | Time (s) | Percentage | Calls |
|---|---|---|---|
| Model Forward Pass | 1030.68 | 98.36% | 13,685 |
| Metric Computation | 16.61 | 1.59% | 13,685 |
| Metric Aggregation | 0.0046 | ~0.00% | 1 |
| Total | 1047.89 | 100% | — |
98.36% of execution time is in the model forward pass. Metric computation, despite running 13,685 times, takes up only 1.59% of total runtime.
This makes sense when you think about it. A 6.9B parameter model doing a forward pass is computationally expensive. Matrix multiplications, attention mechanisms, layer norms, all running on billions of parameters. Meanwhile, metric computation is just some Python code aggregating numbers.
The Harness is running on native PyTorch inference. There are ways to optimize this (like torch.compile, SGLang, vLLM), but that’s a topic for another time.